An introduction to Prometheus — a tool for collecting metrics and monitoring services
I’m working on a scalable SaaS platform that utilizes a Kubernetes cluster to deploy and dispose applications on a regular basis. One of the needs that came up was being able to accurately monitor the usage of resources by users, so they can be charged accordingly by the end of the month. I started with a simple solution of storing counters in the database, but I quickly discovered how much reliability is important when it comes to someone’s credit card. Having the ability to re-visit information or print a graph with all sorts of stats is very reassuring. After digging a little bit, I came across a tool called Prometheus, which can be used exactly for that, but for many other things as well.

Originally, Prometheus was developed by SoundCloud in 2012 as an internal monitoring tool for their services. The project was open-source from the beginning and it got widely adopted quickly by a lot of Docker users, despite the fact that it was never explicitly announced. Fast forward to August 2018, the project was announced as a CNCF graduate. While it was built as a monitoring tool, it can be used for all sort of things:
- Bill calculation.
- Server utilization.
- How much time people spend on reading my articles…
There’re probably many ways to achieve the above, but you should particularly care about Prometheus because it’s the foundation stone that led to the creation of the OpenMetrics standard. So how does it work?
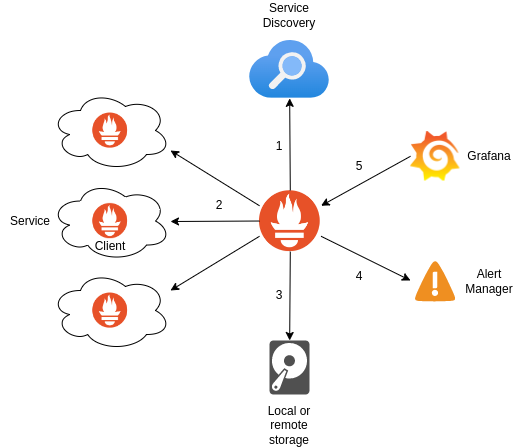
At its core, Prometheus is an HTTP server that every fixed interval executes the following steps:
- Service Discovery — Pull a list of scrape targets that include IP addresses and domain names from an HTTP endpoint or from a file. If the Prometheus server is running on a Kubernetes cluster, it would usually pull this information from the Kubernetes API.
- Scraping — For each service in the list, send an HTTP
GET /metricsrequest and store the metrics for later querying. Accordingly, any application that uses a Prometheus Client and exposes an HTTPGET /metricsendpoint, is scrapable. Node Exporter is a good example for a scrapable application to collect metrics on a Kubernetes node. - Alerting — Send alerts once certain conditions have met, for example: send a “critical” alert if a service hasn’t responded to any metrics request for the past minute. The alerts would usually be pushed to a Prometheus Alertmanager where they can be filtered, aggregated, and grouped before they’re sent out as a notification to other applications, e.g. Slack.
Prometheus uses a special query language called PromQL that’s built to query metrics, for example — give me the total number of HTTP GET requests made in the past 5 minutes:
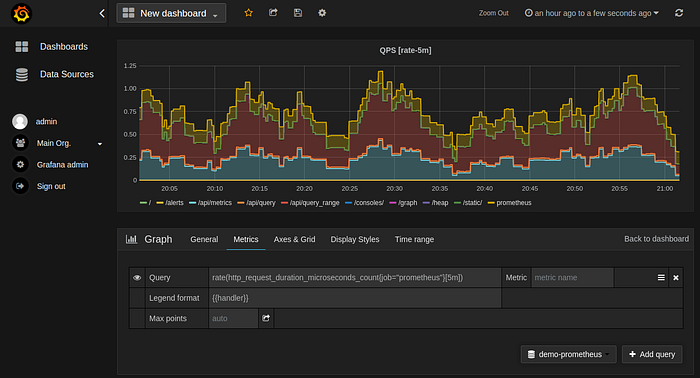
sum(http_requests_total{method="GET"}[5m])Querying is often done in conjunction with a visualization tool, such as Grafana, which is very useful for reading metrics.

To make sense out of everything, I’ve put together a diagram that describes the metrics collection process, from the time they’re created, to when they’re visualized on screen:

I would also like to mention Prometheus Pushgateway, which was built to collect metrics from short-lived targets, such as Lambda functions. Instead of pulling metrics, Pushgateway accepts HTTP POST /push requests of metrics, which will eventually be scraped by the Prometheus Server. In other words, the Pushgateway is a scrape target that represents other targets. Use it mindfully, as it doubles the amount of storage required to store metrics, and it’s unaware of any outages.

So now that we understand the general flow, let’s discuss the metrics themselves. What are they exactly?
A metric is a piece of data that has a name, optional labels, and a value. If we visit the /metrics page of a Prometheus server, we can get a list of all metrics scraped thus far and their present values:
# HELP promhttp_metric_handler_requests_total Total number of scrapes by HTTP status code.
# TYPE promhttp_metric_handler_requests_total counter
promhttp_metric_handler_requests_total{code="200"} 3997
promhttp_metric_handler_requests_total{code="500"} 0
promhttp_metric_handler_requests_total{code="503"} 0
As you can see, names and labels are helpful for describing a metric, which is useful for querying purposes.
There are 4 types of metrics:
Counter
Used when we want to record a value that only goes up, for example:
- Request count.
- Tasks completed.
- Error count.
# HELP promhttp_metric_handler_requests_total Total number of scrapes by HTTP status code.
# TYPE promhttp_metric_handler_requests_total counter
promhttp_metric_handler_requests_total{code="200"} 3997
promhttp_metric_handler_requests_total{code="500"} 0
promhttp_metric_handler_requests_total{code="503"} 0
Gauge
Used when we want to record a value that can go up or down, for example:
- Memory usage.
- Queue size.
- Number of requests in progress.
# HELP prometheus_tsdb_symbol_table_size_bytes Size of symbol table in memory for loaded blocks
# TYPE prometheus_tsdb_symbol_table_size_bytes gauge
prometheus_tsdb_symbol_table_size_bytes 816
While gauge inherits all the properties of a counter, some query functions cannot be applied to it, e.g. rate().
Histogram
Used when we want to record a distribution of values across ranges (aka buckets), for example:
- Request count with a duration between X and Y seconds.
- Response count with a size between X and Y bytes.
# HELP prometheus_http_request_duration_seconds Histogram of latencies for HTTP requests.
# TYPE prometheus_http_request_duration_seconds histogram
prometheus_http_request_duration_seconds_bucket{handler="/",le="0.1"} 4
prometheus_http_request_duration_seconds_bucket{handler="/",le="0.2"} 4
prometheus_http_request_duration_seconds_bucket{handler="/",le="0.4"} 4
prometheus_http_request_duration_seconds_bucket{handler="/",le="1"} 4
prometheus_http_request_duration_seconds_bucket{handler="/",le="3"} 4
prometheus_http_request_duration_seconds_bucket{handler="/",le="8"} 4
prometheus_http_request_duration_seconds_bucket{handler="/",le="20"} 4
prometheus_http_request_duration_seconds_bucket{handler="/",le="60"} 4
prometheus_http_request_duration_seconds_bucket{handler="/",le="120"} 4
prometheus_http_request_duration_seconds_bucket{handler="/",le="+Inf"} 4
prometheus_http_request_duration_seconds_sum{handler="/"} 8.2515e-05
prometheus_http_request_duration_seconds_count{handler="/"} 4
Summary
Used when we want to record a distribution of values across percentiles (aka quantiles), for example:
- Request percentage with a duration of X seconds.
- Response percentage with a size of X bytes.
# HELP go_gc_duration_seconds A summary of the pause duration of garbage collection cycles.
# TYPE go_gc_duration_seconds summary
go_gc_duration_seconds{quantile="0"} 5.4603e-05
go_gc_duration_seconds{quantile="0.25"} 6.5151e-05
go_gc_duration_seconds{quantile="0.5"} 8.1182e-05
go_gc_duration_seconds{quantile="0.75"} 9.6932e-05
go_gc_duration_seconds{quantile="1"} 0.000167744
go_gc_duration_seconds_sum 0.191906531
go_gc_duration_seconds_count 2086
There’re several ways you can get started with Prometheus if you’re using Kubernetes:
- Install prometheus-community/helm-charts via Helm.
- Install Prometheus Operator as a native Kubernetes extension.
- Use a Kubernetes cluster that already has Prometheus avaialble right out of the box. My personal recommendation is CoreWeave.
